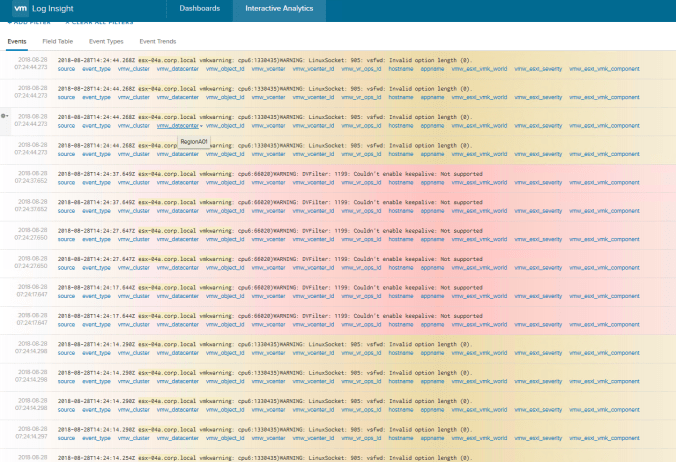
Now that your vRLI install is up and running and you are receiving logging data, it’s time to start looking at the data and seeing how it can be used, filtered and searched.
vRLI has 2 methods of looking at data. The first is by leveraging dashboards, either with pre-created content pack dashboards or by custom created dashboards. The content pack dashboards are specifically put together for products to allow the user to look at the most appropriate data filtered in a way which is best for that product.
The second method is to use live data and filter that data down to concentrate on the things that the user is interested in, excluding everything else from view. We will focus on this method in this post.
Interactive Analysis
The “Interactive Analysis” view shows you all the log data that is within vRLI for the given time frame requested. It will include data from multiple hosts, OS types, event severity levels etc.
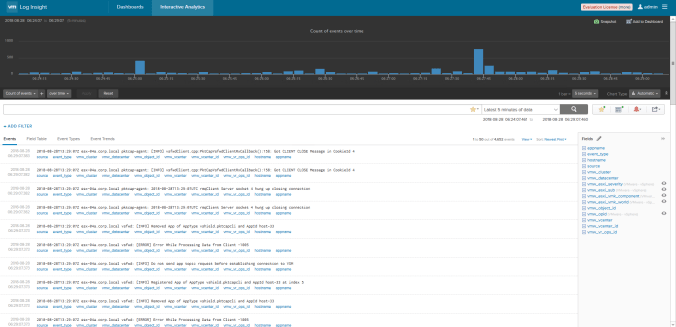
To locate the data you wish to look at you must leverage the filtering mechanism to isolate the events you are interested in. Lets assume for a moment that we think there is an issue with one of our ESXi host and that vROPs has shown us there is a higher than normal usage profile not related to any of the workloads on the host. Lets take a look at the host.
Filtering
First we must filter the events for the host we are concerned with. We can add filters by either manually typing them out or choosing the fields from the auto-defined list on the right of the screen.

Our field selection list on the right hand side of the screen can also be used to double click on a field name and value that has been seen within the the logs.

Once we have our first filter in place the logs will start to show the events and messages which are specific to our filter. Here we have selected our suspected problem ESXi host using the “hostname” field and now the events displayed are only for that host.

Lets see if there are any error messages showing up. To do this we will add a second filter. Our fields list has a field called “vmw_esxi_severity” which grades events in one of 5 categories (verbose, info, warning, error, quiet). As we suspect there could be an issue with this host it would probably be most useful to see anything that is not general info or verbose events. To do this we can either double-click on the column that represents one of the 5 categories or manually add the filter from the top of the page. In this case we will double-click on a category column.
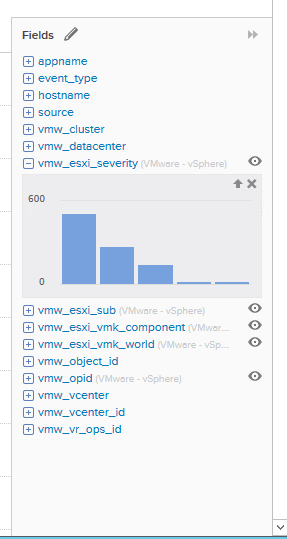
Our filter now has 2 conditions however currently this is going to show all the verbose logging which is not what we want.

You can change the filter by removing any of the values and free-typing replacement values. In our example we want to see errors and warnings so our filter now looks as follows:

Note that in some situations you might want to filter based on several conditions but not necessarily all have to be true at the same time. To do this you can change the matching option from “All” to “Any”.

In our case we want to match both conditions so we will leave the match configuration as it is.
If we see something that looks concerning it is useful to see the frequency and quantity of occurrences. We can do this by using the add filter menu on a representative event and using the “Highlight Events Like This” option.
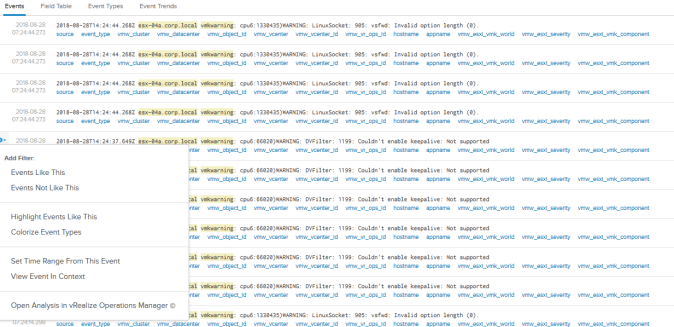
Now we can start to see things such us whether the event appears in groups/batches, how often they appear etc. We can also exclusively filter on this event only excluding all other events for our host.
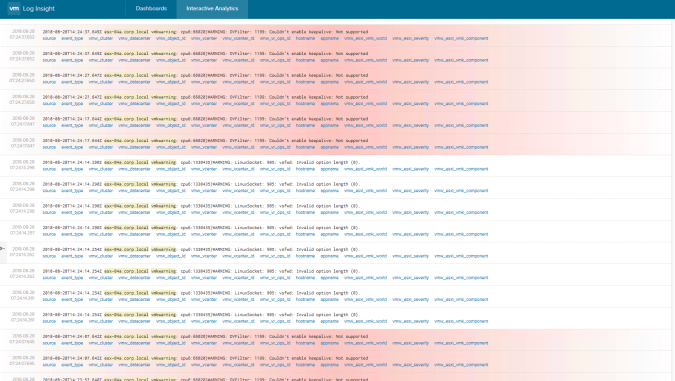
If there are several events that we would like to highlight then vRLI will use different colours which is useful for showing patterns in re-occurring events.
