Overview
During the course of content development within vRealize Operations you will come across occasions where you need to know/show how often and how many certain types of behaviors occur within a given time period. Although we can track when a behavior occurs through the use of symptoms and alert definitions as well as adding threshold lines (yellow, orange and red) to metric charts the resulting output is usually not that useful when it comes to being able to show the hard data within dashboards/reports.
A chart will not answer a question like “how much of the running time of VM XYZ has it spent over 50% utilized” although it will give you a starting indication.
In this article I’m going to cover how you can get creative with Super Metrics to show information around data frequency and quantity and then leverage that information within views (and by association dashboards and reports).
The Trouble With Charts And Lists
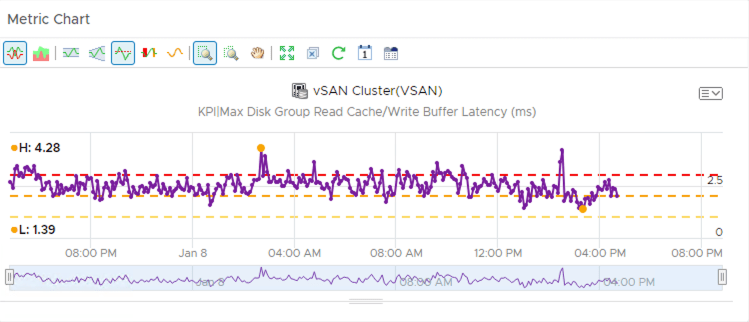
Charts are great for showing you metric data as it is occurring and providing a graphical history of what has occurred. What they are not very good at is giving you precise quantitative information. For example, for my vSAN cluster I would like to know how often the ‘KPI Max Disk Group Read Cache/Write Buffer Latency” metric is above 3ms. Here’s a basic metric chart on a custom dashboard with some threshold lines added which gives me a rough idea but not the hard numbers.
Similarly with Object Lists, I can show the current value for a metric on an object however I cannot quantify the frequency. To resolve this issue I’m going to show you how Super Metrics and Views can provide the ability to show this type of information.
Setting The Threshold
In order to know how often something is happening you need to track every occurrence in a way that can be counted/manipulated. vRealize Operations of course knows all the data points of a metric on an object but as a user I cannot retrieve frequency numbers. Instead I need to use the metric information that is available to track occurrences in a way that I can reference.
This means creating a Super Metric that records a set value every time my condition is met. Those metrics can then be added together to give a quantity of occurrences.
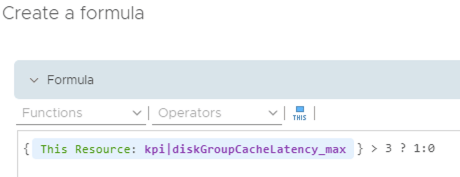
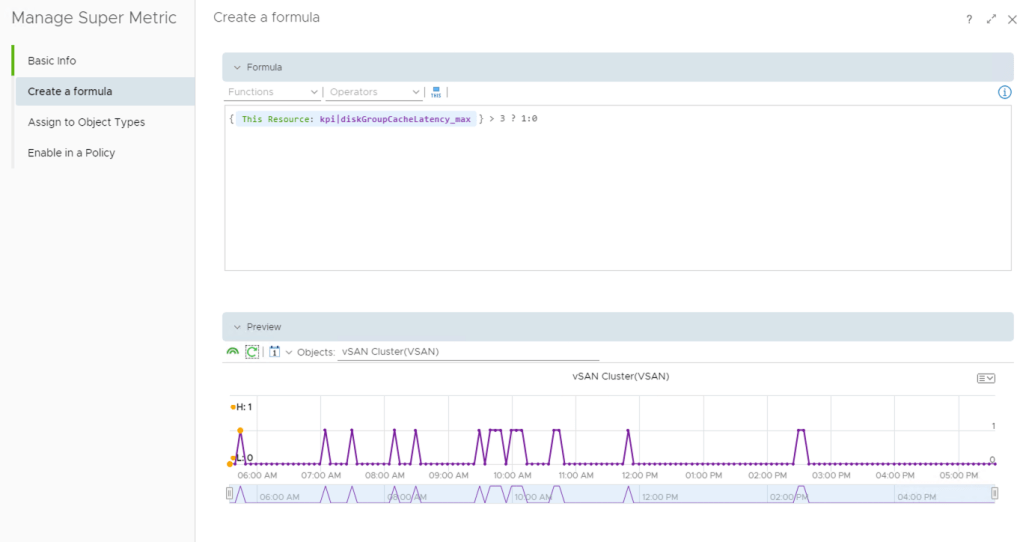
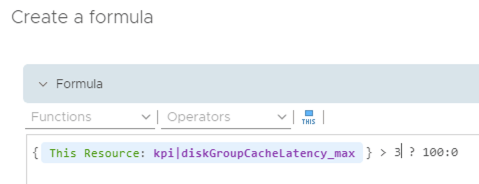
To create the Super Metric for my scenario I need to define a condition within the metric together with what t do if this condition is or is not met. Here my metric formula says that if the read cache write buffer latency is greater than 3 then set the Super Metric value to 1, otherwise set it to 0.
Previewing the Super Metric shows 1’s and 0’s being recorded as expected.
Transforming The Super Metric
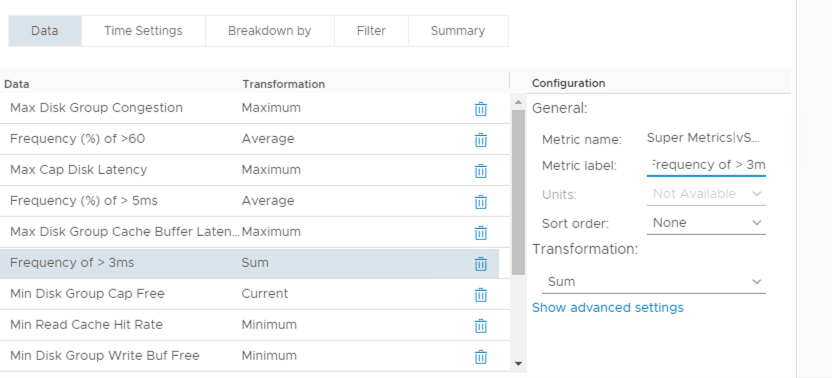
Although I now have a marker being registered every time my SLA is being breached I now need a method of aggregating all the markers together to give a value over time. To do this I’m going to use a View to show and transform the Super Metric using the “Sum” transformation option.
Here I have added my Super Metric to the view (highlighted row) and by specifying the view time settings as a specific period (i.e. last 7 days) the quantity of occurrences shown when the view is loaded will be within the last 7 days (e.g. SLA breached 25 times in 7 days).
However, what this doesn’t show is 25 times out of how many data points. It would be more useful to represent this information is a percentage of the data set (i.e. 25% of the time the latency metric was in breach of the SLA). Showing the information in that way is much easier to digest.
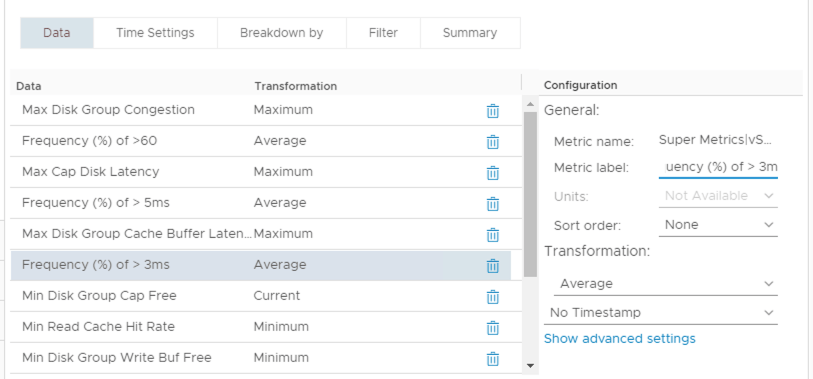
To provide this information as a percentage I need to make a modification to the Super Metric. Instead of recording a 1 every time my SLA is breached I need to record 100. This will enable me to average the values rather than summing them, to produce a percentage.
My Super Metric now looks as follows.
I can now modify the View and change the transformation function from “Sum” to “Average”.
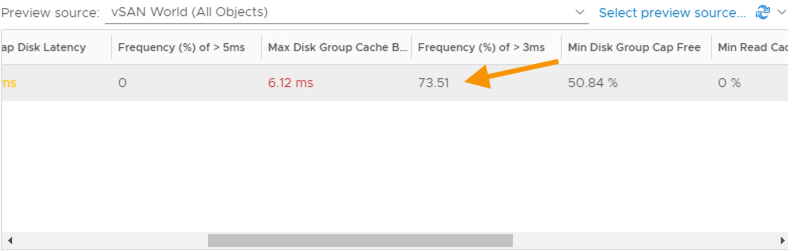
Now when I preview against a live source I get a true percentage value. In this example my latency metric has a max value of 6.12ms (this is not important for this example) and 73% of the time is above my 3ms SLA I set within the Super Metric (remember this view is using a last 7 day time period so 73% of the time over the last 7 days).
Now I can show exactly how much time a metric threshold is spent breached and as this is within a view I can drop this into a report for management consumption.
