Super Metrics are often regarded in the same way as Dynamic Types are in vRO (i.e. too difficult to use). However if you are familiar with vROPs metrics and you can use excel then creating a Super Metric should be easy!
The first question is why to use them? Lets take an example scenario.
The Scenario
Your boss has specified that he wants to know the average memory utilisation of VMs on a particular set of hosts and be able to trend this utilisation over time as well as alert on when a particular threshold is crossed.
To satisfy these requirements we need to know the average memory utilisation for all the VMs on a vSphere host. If we have this metric then the rest is easy (custom dashboards, symptoms and alerts). The problem we have is that there is no metric available at the host level that will give us this information (we have total utilisation but not averaged across virtual machines). This is a prime candidate for a Super Metric!
Creating the Super Metric
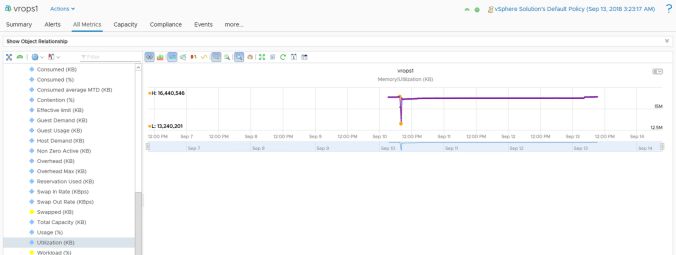
Before we do anything with Super Metrics we first need to identify the name of the standard metric(s) that we need to use to form the Super Metric. It’s much easier if we do this first by looking at an example source object (a Virtual Machine) so that we can flip through all the metrics and output graphs that are available and locate those required.
In this case the “Utilization (KB)” metric looks to be what we need.
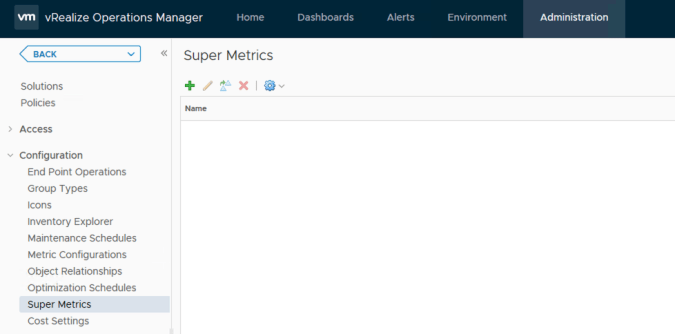
Now we can start the process of creating the Super Metric from the “Administration” tab and under “Configuration”.
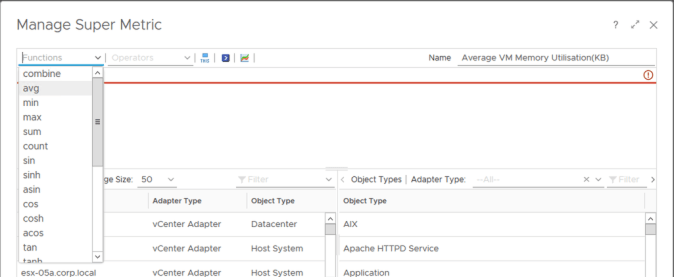
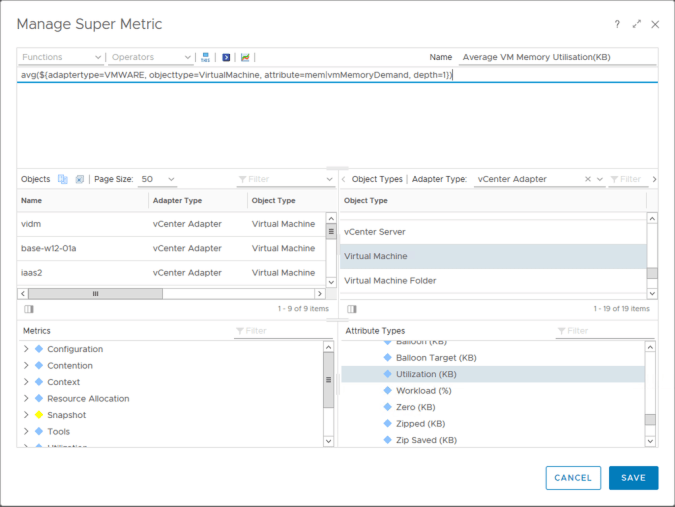
The first thing we need to do is give our Super Metric a name that identifies what the metric is for to enable users to know what it does and when to use it. We also need to decide what sort of formula we need to put together to calculate our metric. We know from our example requirements that it needs to be an average across multiple values so our function will be “avg”.
Just like any other formula, we need to use brackets to contain the information of what we are going to average. These are added from the “Operators” menu.

Once our brackets are in place we can place the cursor in between them. This means that whatever we do next will be placed within the brackets. Our source metric is on a Virtual Machine object so we need to locate that metric by selecting that object type.
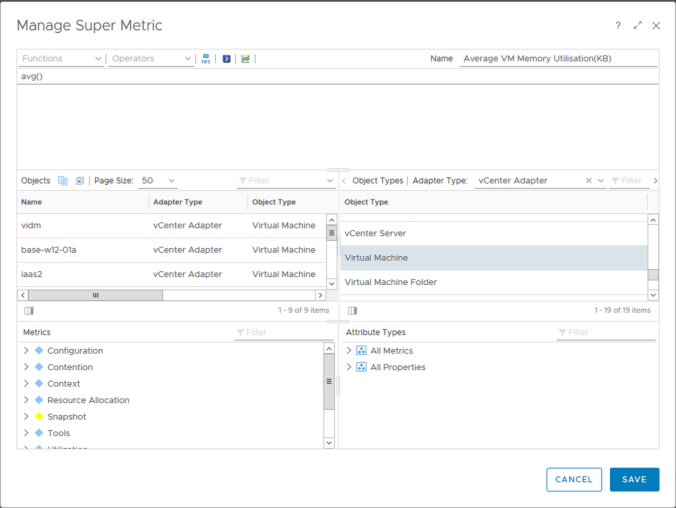
When we find the “Utilization (KB)” metric it can be double clicked on to add it into our formula. It is automatically added with a “depth=1” value on the end of the formula which means it will be assigned to one object above a virtual machine.
Lets explain this. If you want to know the average value of a metric across a number of objects you need to think where this metric needs to be displayed from. We want the metric on each host but equally you might decide to add it to the compute cluster instead in which case your depth would be “2” as a Virtual Machine object is 2 levels below a cluster (see below).

You can also use the “THIS” button if you are creating a Super Metric that is taking data from a metric of the input object, rather than the input objects child objects.
Once we are happy with the formula and depth it is always advisable to use the preview button and select an object to validate the formula is working and displaying what you expect it to. We want this Super Metric to be applied to the “Host System” object so we preview it based on the same object type.
If everything is as expected then the Super Metric can be saved.

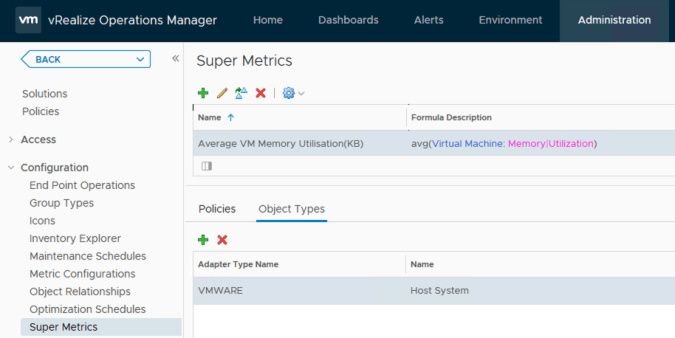
Although our Super Metric has been created it hasn’t been attached to an object type yet. We’ve defined within the metric what it should be used on and what detail should be used for the formula but now we need to create the association with the source object, in this case the “Host System” object. We do this using the “Object Types” plus icon in the bottom half of the Super Metrics screen.


Using the Super Metric
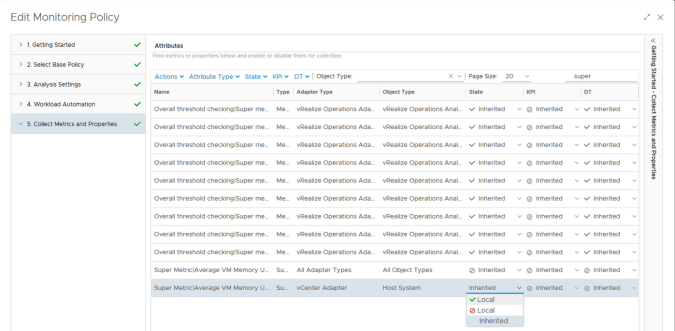
Once the Super Metric has been defined and associated to the object type we need to tell vROPs where to use it. Just like any other metric, we do this via “Policies” by editing the required policy before locating our Super Metric and enabling it. If we have multiple policies that are in use for different vCenter instances then we need to edit the policy that covers the correct host servers.
Once the policy is saved then vROPs will start collecting data and calculating the information required to compute the metric. The Super Metric will NOT display against the chosen source object type until one data collection has been completed.

After several data collections the graphs for the metric will start to populate with meaningful information.
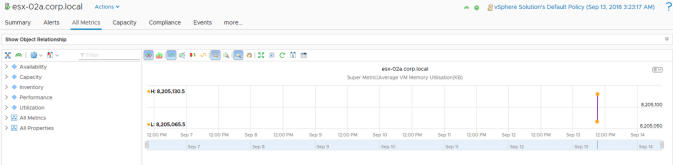
Now we have the Super Metric and it is providing data we can use it for any symptoms, alerting and custom dashboards we desire.
There are many other functions and operators available to perform a variety of more complex computations. Hopefully this has provided an insight into what is possible.

Pingback: V4Free – vRealize Operations Manager – Noetic Views
Pingback: V4Free – vRealize Operations Manager – Noetic Views