Views provide you the ability to define a set of metrics or properties that you might commonly and repeatedly use together for a specific object type. The information displayed in a view can either be a:
- List – data about an object (or objects) displayed in a table with one object per line
- Summary – data about an object displayed in a table with each line representing a different metric/property of the object
- Trend – metric graph data with optional trending and forecasting
- Distribution – pie chart or bar chart break down
- Text – selected metric/property values displayed in customized free form text
- Image – a static image
Creating a View
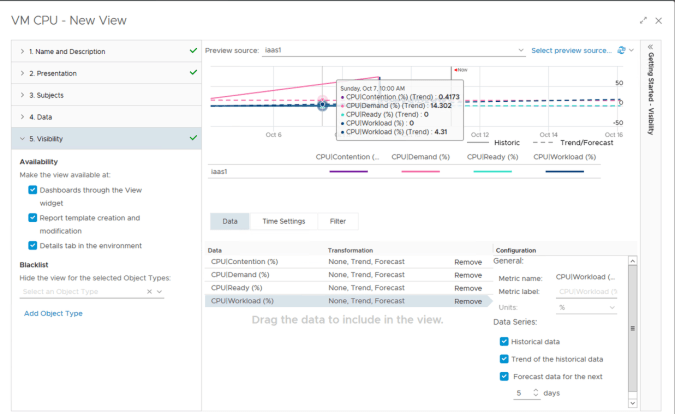
In this example we will create a view for a set of VM CPU metrics that you might want to use together. The data will be displayed as a “Trend” presentation so that historical and predicted information can be displayed to show how a selected VM has been performing up to now and how it is forecasted to perform in the future. The configuration options for this view will be:
- Presentation – Trend
- Subjects – Virtual Machine
- Data
- CPU Contention%, CPU Demand%, CPU Ready% and CPU Workload%
- Historical data, Trend of historical data and Forecast for the next 5 days
- Visibility – Dashboards, Reports, Details
For our example a VM object has been selected to use as a preview source to show you how the data will be displayed before the view is committed.
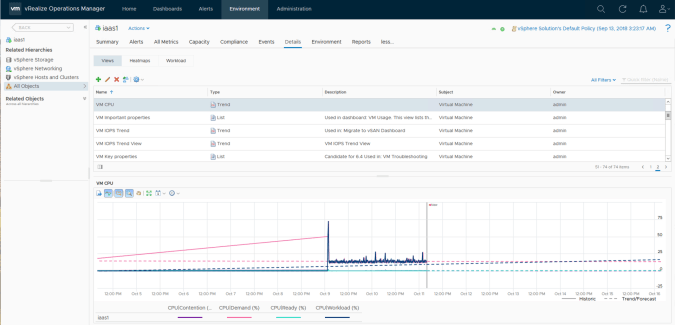
Once the view is saved it can be seen and used with any subject (object) of the same type from the “Details” tab of an object. The new view may also be used on custom dashboards just like any of the standard widgets, by dragging and dropping as appropriate.
If we select any Virtual Machine object from the “Environment” tab the view will be available to select from the “Details” area, giving the user historical charts and forecasted charts for the metrics within the view.