This week I had an interesting use case for “Super Metrics” for a customer who needed alerting for vSAN for a specific scenario.
The customer was running vSAN stretched clusters with vSAN fault domains and needed to know when a certain percentage of hosts within a fault domain had failed so that they could potentially issue automated shutdown commands to the remaining hosts within the fault domain.
The idea was to prevent vSAN from trying to rebuild data onto the remaining hosts within the partially failed fault domain that might not have sufficient capacity left within it to succeed. This is obviously an extremely specific use case for this customer but it serves as a good example of how Super Metrics can be used.
Why Super Metrics?
If we want to know when a percentage of vSAN cluster hosts have failed within a fault domain then we need to know the following:
- How many hosts are configured in the fault domain
- How many hosts are running in the fault domain
- A percentage metric that shows current hosts availability if none of the other 2 metrics are available
As we are dealing with fault domains the metrics/properties need to be available on the fault domain vSAN object type. Sadly the metrics available only show the configuration/resources that are currently available and not those of the original configuration under normal scenarios. In other words as hosts within a fault domain fail we have nothing to compare them to in order to generate a percentage value.
We could use the standard metrics and “Dynamic Thresholds” to alert when the number of running hosts within the fault domain changes from normal however this does not allow us to leverage specific percentages so that alerting is only carried out under exact matching conditions.
In most scenarios Super Metrics are not required however in this case the standard metrics and properties available within vSAN objects cannot give use the data needed so Super Metrics can be used to fill the gaps.
What Do We Need?
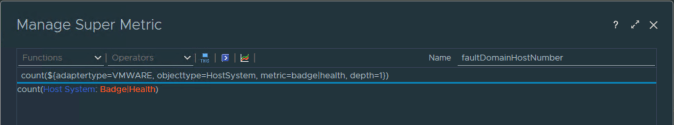
The first metric we need is for determining how many hosts are configured in the fault domain. We do this by counting the number of a specific metric of host systems within a fault domain. You can use any metric for the count and in this case I have used the health badge metric. The metric is for the vSAN Fault Domain and counting objects beneath 1 level down therefore we specify a depth of 1 (host systems are one level below a fault domain in the object tree). “THIS” is NOT used as we are aggregating data from multiple objects.
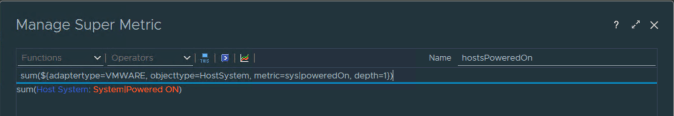
The second Super Metric is for showing how many vSAN hosts are currently available. The “System|poweredOn” metric provides a value of 1 against any host that is on so if we sum this metric across all the hosts within the fault domain then this will give us the total number of hosts currently available. Again, a depth of 1 is required.
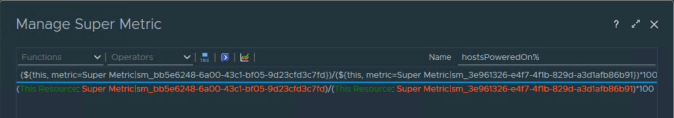
Our last metric is for using the first 2 Super Metrics to calculate a percentage value. Since this metric is using data at the same level the Super Metric will be displayed at (i.e. on the fault domain) “THIS” is used.
All the “Super Metrics” are linked to the “vSAN Fault Domain” object type and then added to the current vSphere Solutions policy. As with any other new metric, it takes a data collection cycle before they become visible against the object type.
The Result
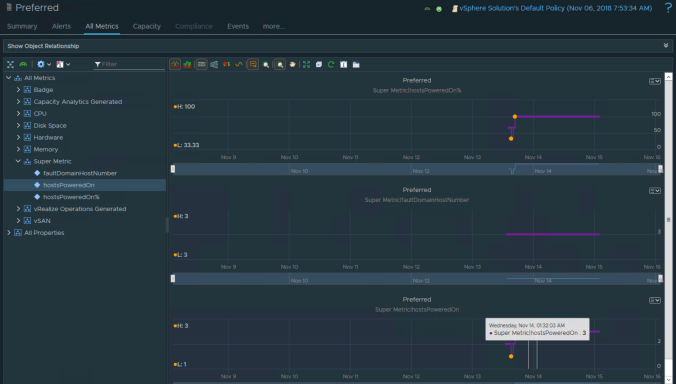
After a data collection cycle the metrics are visible and will start to show valid data. In the screen shots below you can see that the number of hosts configured in a fault domain is static however as hosts become unavailable the “poweredOn” metric changes which also changes the Super Metric for the percantage of powered on hosts.
The “hostsPoweredOn%” Super Metric can now be used to define a symptom and alert as per normal operations and the vRealize Orchestrator Management Pack can then be leveraged to issue automated processes based on the alert.
