Overview
Service Discovery (as a management pack) has been around for a while (since version 6.6 of vRealize Operations) but I find it is one of those packs/features that just gets overlooked. With 8.0 reaching GA I feel it’s time to go back and re-discover it (forgive the pun) and show you what it can do.
What Does It Do?
At a very high level it allows vRealize Operations to discover application services that are running on VMware based virtual machines, collect basic metrics for those applications and build vRealize Operations Application objects to show inter-dependencies between VMs and services.
With minimal configuration vRealize Operations can show you the health of an overall distributed application (to a level) and the various sub-components as well as rolling up alerts from sub-components to the root application object.
There are a few caveats, namely operating system support:
| Operating Systems | Versions |
| Windows | Windows 7, Windows Server 2008/R2 and above |
| Linux | Photon, RHEL, CentOS, SUSE Linux Enterprise Server, OEL, and Ubuntu (all Linux operating systems must be based on kernel version 2.6.25 or above). |
The Same But Different
Although a lot of the functionality is the same from previous vRealize Operations versions, the way it is now implemented in 8.0 is completely different. Management packs are located under “Solutions > Repository” with Service Discovery being installed by default.

Configuration of the management pack is not done from the Repository, instead it is driven from a vCenter based “Cloud Account” (or accounts). Yes that’s right, it’s not supported for Azure or native AWS but is supported for VMC on AWS. That’s because it relies on VMware functionality, specifically VMware Tools.

To start the configuration off you simply edit your chosen vCenter cloud account where you should find a “Service Discovery” tab. This enables you to provide some default credentials to be used for Windows and Linux machines.
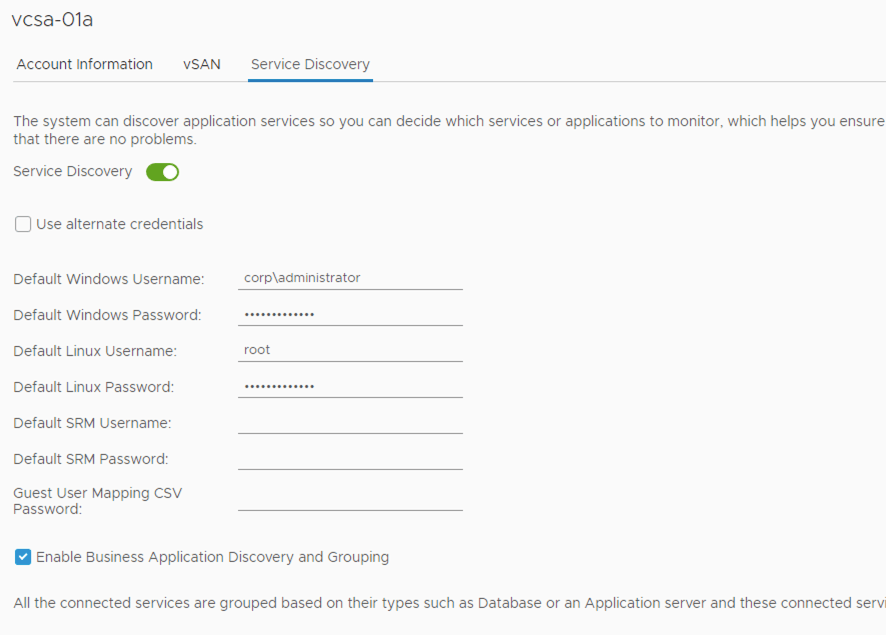
The assumption here is that the majority of your machines have a service account that can be used on them which is valid for them all (yes I know it’s a big assumption!).
Enabling “Business Application Discovery and Grouping” tells vRealize Operations to automatically build Application objects within the inventory for distributed applications it discovers. This is not mandatory to use Service Discovery.
Once data collection has been through a cycle or two you can access Service Discovery from the home screen to see if anything has been picked up. Here you can see a number of my VMs have had services discovered on them. Note that we don’t discover services from every possible application that has ever been written. Instead we support a core set of known services and provide you the option (“White List”) to specify your own definitions for anything else.

The screen does not show you whether all of the services found are on a single machine or whether they are all on different machines, only that they have been discovered. My environment also has a number of VMs and looking at the services that have been discovered I am pretty sure not everything has been picked up.
The “Manage Services” button takes you straight into the object inventory to the “Manage Services” section. Here you can see everything that has been discovered and everything that has failed.

The primary reason for failure is due to incorrect credentials for the machines. You can select one or more machines and override the default credentials however there is a caveat with this. For the override to work you must be on a minimum version of VMware Tools (see https://kb.vmware.com/s/article/75122).

What Can I See Now?
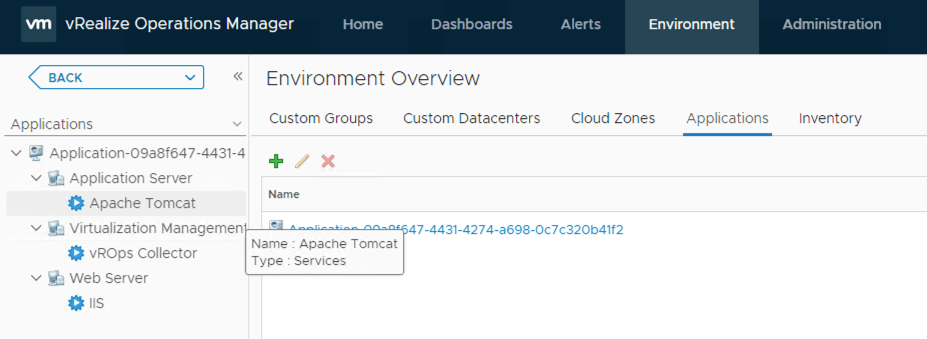
Well, quite a bit actually. First of all lets go and see if vRealize Operations has automatically built any applications from the discovery process. Here you can see some of my vRA 7 stack (note that my SQL VM is not running the right version of VMware Tools and is therefore not discovered). The application name is auto-generated as vRealize Operations has no idea what the whole app should be referred to as. You can always rename each application as appropriate.
Now lets look at a VM and see what it shows when I look at object relationships. Well, actually not a lot at first glance. All I can see is just the typical vSphere inventory things. However, if I use the “switch” button (marked below) then I can see a list of object types that are related in some way to the VM I am using in this example.

This takes me to the “Object Relationship” inventory view and if I select “All Objects” from the list I can see much more.
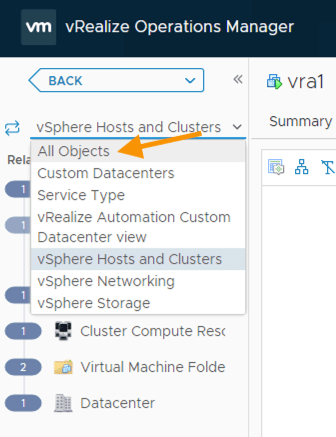
I can see all the object classifications which you can expand if desired.

If I go back to the object relationship map then things are a lot clear as shown below. I can now see the two services that were discovered on my vRA VM together with the health of each.
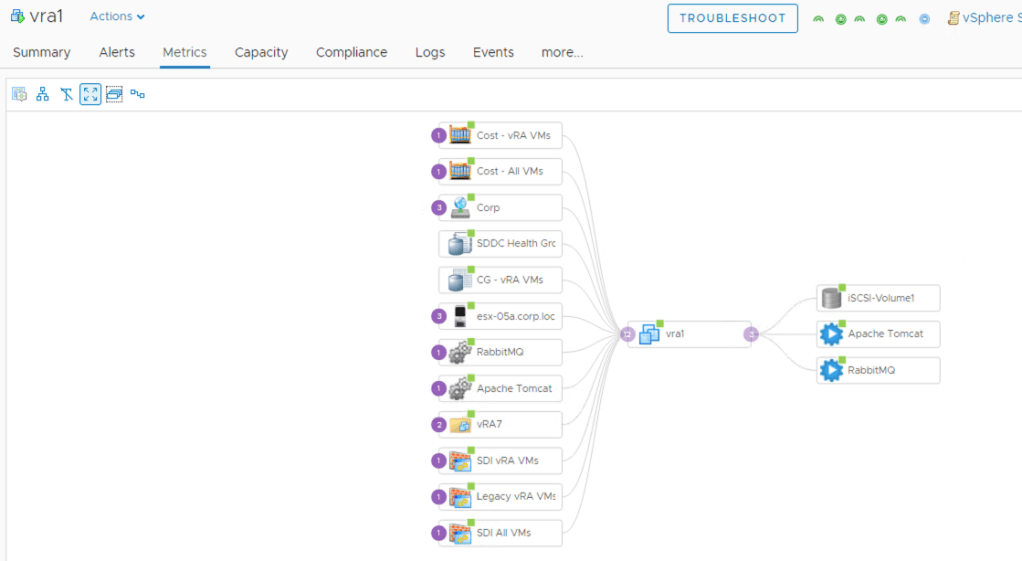
Selecting a service allows me to then view the metrics for that service. Here I am looking at the read throughput for the Apache Tomcat service.
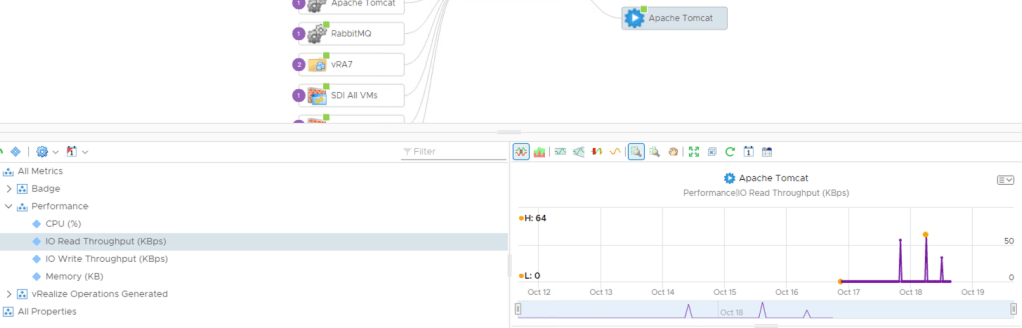
The metrics available are not extensive and they are reasonably high level providing data such as the amount of CPU and memory a service is using, throughput etc. There are also no symptom or alert definitions predefined for any service so if you want to generate alerts using the service discovery data then you will need to define these yourselves.
Properties also provide data that shows how the service is configured. Here I can see the install location of the tomcat instance within my vRA appliance.

Do I Get Any Dashboards?
Yes. I can find out from clicking on a service what it talks to, the VM it is on and what VMs those other services reside on.

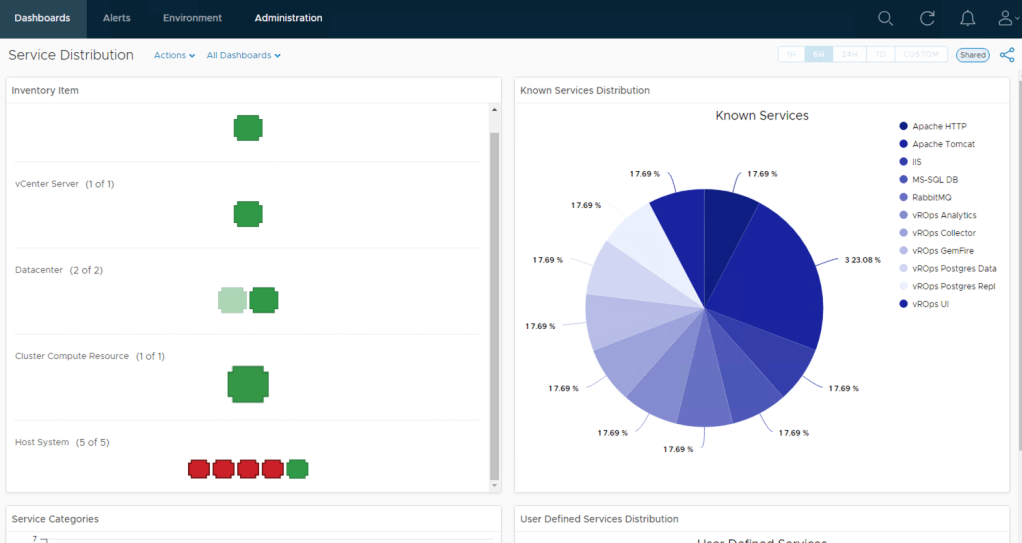
I can also find out the distribution of services within particular areas of a virtual estate (i.e. a cluster, datacenter etc.).
That’s not bad for just using VMware Tools and the power of vRealize Operations. But what if you want to go deeper into your applications. Well stay tuned for the next article on Application Discovery!

Pingback: vRealize Operations – Application Monitoring | vnuggets